
Trusted by clients from global brands to local charities


Sound familiar?
If you have to ask someone to pull the numbers, you're already behind.
By the time the weekly figures are ready, the week has moved on, and every manager keeps their own spreadsheet of what they think matters.
I find out we're behind when a customer chases.
Every manager has their own KPI spreadsheet.
The weekly meeting starts with arguing about the figures.
We can see this week. We can't see the trend.
Systems applied to the numbers
See the same day when something slips
One screen with the figures that tell you the operation is on track, drawn from the systems where the work happens.
Jobs and orders
What's in, what's moving and what's late.
Workload by team
Who's stretched and who has room.
Exceptions flagged
The few things that need a person today.
What we report on
Whatever tells your operation it's on track. These come up most.
Jobs and orders
Volumes, stages and anything running late.
Stock and capacity
What you have, what's committed and what's running low.
Workload and utilisation
How busy each team is, and where the time goes.
Service levels
Response and turnaround times against what you've promised.
Delivery and dispatch
What went out on time, and what didn't.
Trends over time
This week against last month and last year, so a slide is spotted early.
How we work with your data
Data, then information, then insight, in that order.
Reports inside one system, and reports across all of them
 Midton
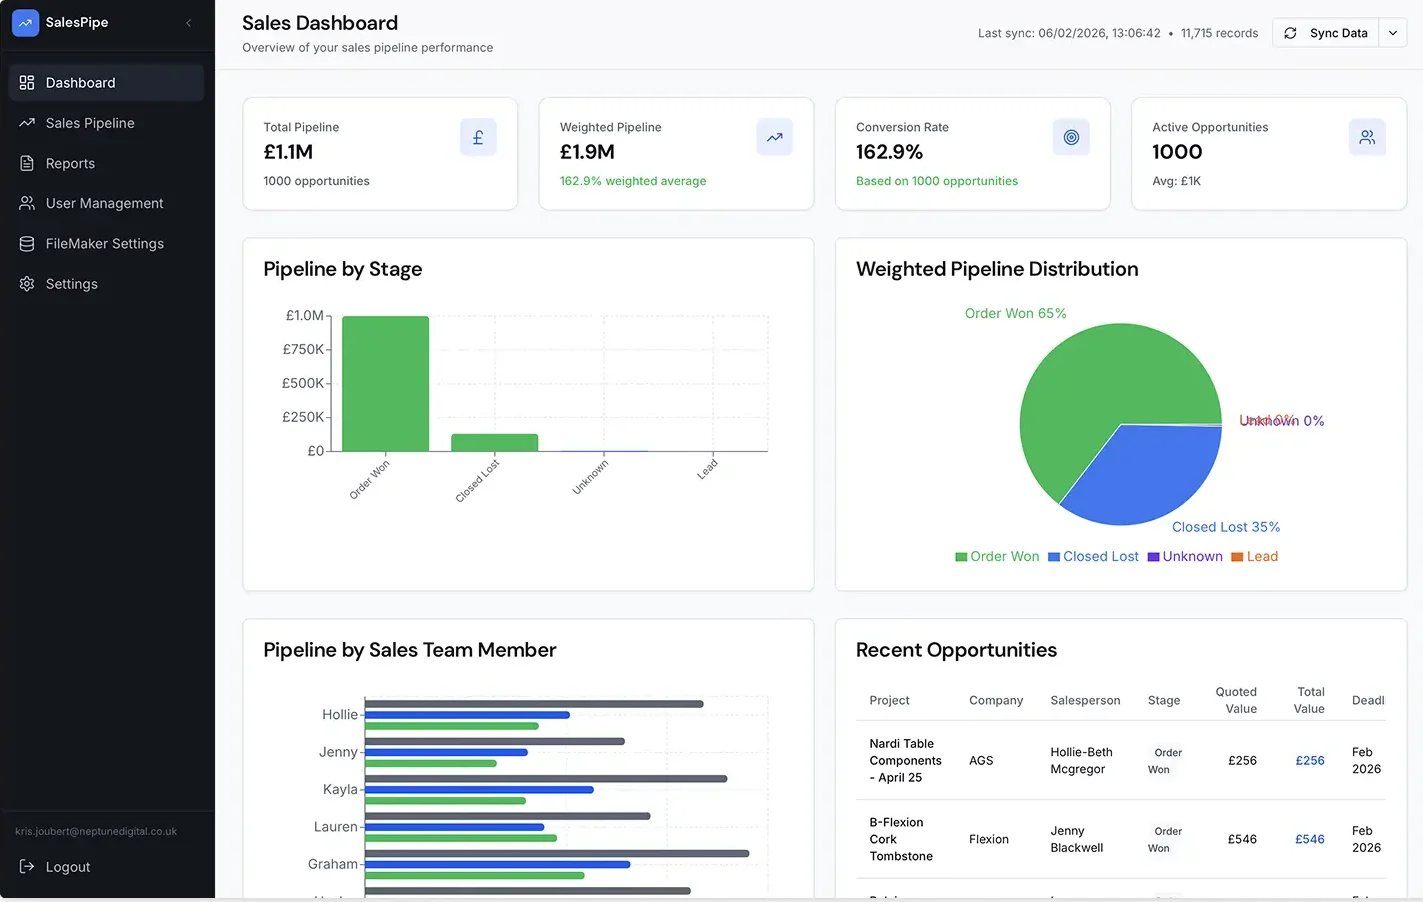
Custom Sales Pipeline Dashboard
We built a custom web-based sales dashboard that connects directly to FileMaker data, replacing an off-the-shelf CRM solution. The dashboard provides real-time pipeline visibility and performance tracking across all sales stages.
OperationalFileMaker
What clients say about working with us
Extremely satisfied. The team are extremely responsive, flexible, fast, and precise in all areas. We started together with a small project, and have since expanded the SoW significantly after the service and talent we got. 10/10, would recommend.
 William HillCEO, Bascule Insurance Services LLC
Working with Neptune has been an exceptional experience from start to finish. Their dedication, expertise, and swift execution in developing our system left me thoroughly impressed. The seamless communication and willingness to go the extra mile demonstrated their commitment to delivering excellence. Overall, my experience with Neptune has been nothing short of outstanding.
Jacquie FreearPurchasing Manager Neptune provided an excellent professional, knowledgeable service and offer exceptional value to any project. Thank you to Jordan and the Team.
 Darren WilliamsProduct Owner, Solotech
Questions about operational reporting
Most systems with a way to get the data out: your operations system, CRM, finance software and spreadsheets. We bring it together in one place first, so the figures agree.
As up to date as the systems feeding them. In most cases that means the figures move as the work happens, not once a month.
Yes. Each team sees what it needs, from the same underlying data, so the numbers match across the business.